Logging with Logstash, ElasticSearch, Kibana and Redis

Logging with Logstash, ElasticSearch, Kibana and Redis Link to heading
From a vagrant image to a working application Link to heading
Introduction Link to heading
As a fan of metrics and of acquiring as much useful information as possible my go-to tool is Statsd and Graphite but when I need to drill down for more information either to provide business information or just to track down a bug I need to get quick access to all the logs related with a specific query. I need these logs to be parsed, centralised, filtered and ready to go.
This tutorial explains how to get from a bare bones Vagrant image into something useful. Ideally I would do this through proper automated provisioning with Chef, Puppet or CFEngine but as a learning experience and a way to play around with configuration I’ll go through the steps one by one.
Vagrant Link to heading
Vagrant is a quick way to make a portable separate environment in which to test new tools and applications — I used the Ubuntu Precise 32bit image to make this example.
vagrant init precise [http://files.vagrantup.com/precise32.box](http://files.vagrantup.com/precise32.box)
The only configuration requirements for your Vagrantfile needed to complete this are:
config.vm.forward_port 80, 8080 #for Kibana3``config.vm.forward_port 5601, 5601 #for Kibana2, if you prefer``config.vm.forward_port 9200, 9200 #for ElasticSearch Master
After that just run and SSH into the new image
vagrant up``vagrant ssh
I’d also suggest adding a few tools
sudo apt-get update``sudo apt-get install vim zip
Kibana 2 — you can skip this and go to Kibana 3 Link to heading
Once you’re in you can get a copy of Kibana 2 and install it as well as all tools required for it.
sudo apt-get install build-essential g++``wget [https://github.com/rashidkpc/Kibana/archive/v0.2.0.zip](https://github.com/rashidkpc/Kibana/archive/v0.2.0.zip)``unzip v0.2.0.zip``cd Kibana-0.2.0``sudo gem install bundler``bundle install
The only configuration you’ll need at KibanaConfig.rb is to change the address Kibana listens on so it works with the port forwarding.
KibanaHost = ‘0.0.0.0'
You can run Kibana as any other ruby application. It will use the default port 5601 which is already forwarded.
ruby kibana.rb
Kibana 3
Kibana 3only needs a web server to run so the quick and dirty (don’t do this even near Production!) way to get it up would be to install one and change the default website to show it.
sudo apt-get install nginx``wget [https://github.com/elasticsearch/kibana/archive/master.zip](https://github.com/elasticsearch/kibana/archive/master.zip)``unzip master.zip``sudo cp -R ~/kibana-master /usr/share/nginx/kibana-master
On /etc/nginx/sites/available/default just move the default website root to Kibana
root /usr/share/nginx/kibana-master;
And reload the web server to apply the changes.
sudo service nginx restart
I’m assuming that either Kibana installation is looking into the default ElasticSearch port 9200.
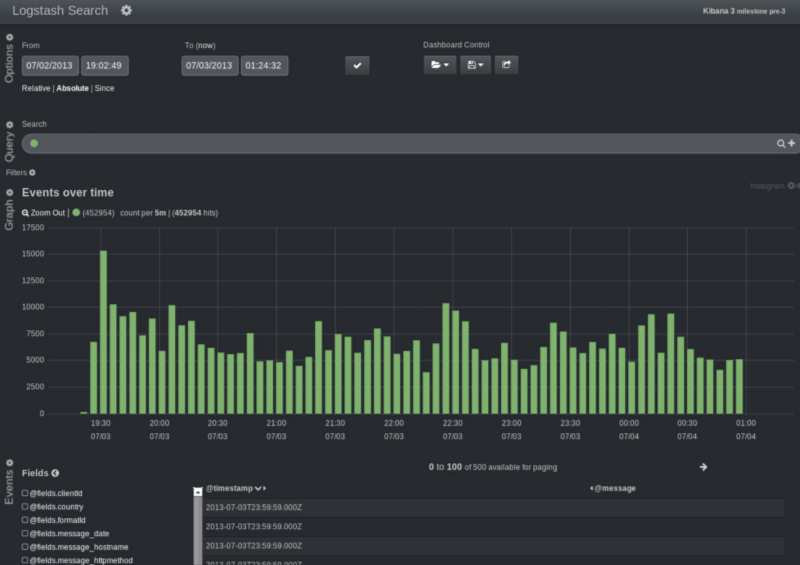
Kibana3 looking very good
Elastic Search Link to heading
Elastic Searchwill allow to query all the data from the logs, you’ll need to install Java.
sudo apt-get install openjdk-7-jre-headless
As well as change the cluster name on config/elasticsearch.yml in if you have other people testing it in the same network as it comes with auto-discovery on — this will allow you to start several instances of ES simultaneously to practice different combinations of number of indexes, shards, replicas and more.
cluster.name: goncalo-elasticsearch
To manually start one instance (or a new one) just use:
./bin/elasticsearch -f
This instance will automatically set itself on the default port and as a Master node.
A helpful plugin for ES is Head which will give you a graphical interface to add, change and delete indexes, browse data and more.
You can add it to your local development environment as your vagrant image will be forwarding the ES port.
git clone git://github.com/mobz/elasticsearch-head.git``cd elasticsearch-head``open index.html
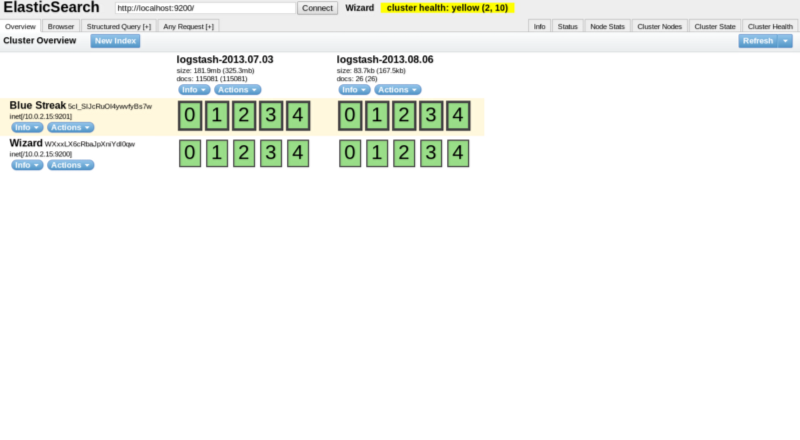
ES Head plugin running on local box
The default set up will provide indexes with five shards and one replica.In the screenshot above I have two nodes (Blue Streak and Wizard), two indexes (logstash-2013.07.03 and logstash-2013.08.06) and each shard has one replica.
All master copies of each shard are in Blue Streak with the bold line.
Logstash Link to heading
Logstash will give you a way to read, parse logs as well as push them into ES. Just get a new copy of Logstash and create a configuration file for it.
mkdir logstash``cd logstash``wget [https://logstash.objects.dreamhost.com/release/logstash-1.1.13-flatjar.jar](https://logstash.objects.dreamhost.com/release/logstash-1.1.13-flatjar.jar)
Given a folder with logs being shipped from a CDN we can create an input filter in a new custom configuration file i.e. log.conf. More information can be seen in the Logstash tutorial
file { path => “/home/vagrant/logstash/*.log” type => “cdn” }
As well as several filters. Grok will apply a pattern to split all the fields, There is a good list of Grok patterns here and an online tool to test patterns here.
grok { type => “cdn” pattern => “%{IPORHOST:message_ip} % {IPORHOST:message_hostname} — %{HTTPDATE:message_date} \”%{WORD:message_httpmethod} %{URI:message_uri} HTTP/%{NUMBER:message_httpversion}\” %{NUMBER:message_responsecode}” }
KV will split the URL query string parameters into new fields, this will be useful for filtering logs.
kv { field_split => “&?” }
Mutate will change current fields in the pipeline, I’m using it here to remove the original unparsed message as well as other information generated by the input filter.
mutate { remove => [ “[@message](http://twitter.com/message)” ] remove => [ “[@source](http://twitter.com/source)” ] remove => [ “[@source_path](http://twitter.com/source_path)” ] remove => [ “[@source_host](http://twitter.com/source_host)” ] }
Date will parse and assign the log timestamp with the one from the CDN. By default this is the timestamp of the ingestion through the input filter.
date { match => [ “message_date”, “dd/MMM/YYYY:HH:mm:ss Z” ] }
As an ouput filter we’ll add a stdout so we can visualise what is being ingested. As well as the elasticsearch_http filter (I use this instead of the default ES one as it is version independent).
stdout { debug => true debug_format => “json”}
By default the flush_size will be 100 and the index name will generate per timestamp by as logstash-[current date]
elasticsearch_http { host => “localhost” port => “9200" }
A working copy of this filter (for my own logs) will be here
You should now be able to add or append new logging rows which will be ingested. You’ll be able to query the data on both the ES Head and on either of the Kibana interfaces.
There is a very good read about optimising index sizes and more here in the Logstash Github account.
Redis Link to heading
There are a few reasons to add Redis, RabbitMQ or another way to queue entries. You’ll want to split the filtering from the ingestion in a centralised manner, add several Logstash shippers or just have a way to buffer new logs from any type of slower parsing.
There is some more information about how to do this in the Logstash advanced tutorialand in the Kibana advanced tutorial.
**sudo apt-get install redis-server**
Now you can split the original log.conf into two files depending if they’re reading into Redis or grabbing from the queue, parsing and sending to ES.
Depending if it’s the input file (example here) or the output file (example here) you’ll add the Redis filter in the correct place.
redis { host => “localhost” type => “cdn” data_type => “list” key => logstash” }
Now you just need to use Logstash for each config file or even add them to the same folder and run Logstash with both at the same time.
java -jar logstash-1.1.13-flatjar.jar agent -f redisconf/
You can now verify with any query that the data is still being received by ES and query the Redis CLI to check current queue length.
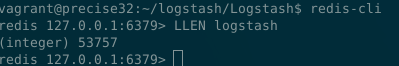
redis-cli
Conclusion Link to heading
This group of tools work out of the box, I felt this was a good exercise to try out the latest versions of each and to have a better understanding to write configuration and automation when required.
After being through the individual tutorials I felt it lacked a unified tutorial that went through the problems I faced while going on each step.
Setting up these tools is only half the battle. The system needs to be configured and set-up in a way that the logs are filtered in a useful way as well as prepare all of these for the most performant/resilient combination possible.